

Usage Report
The Usage Report tracks conversations, messages and token usage across your organisation. Where the Cost Report answers "what did it cost?", the Usage Report answers "how much is it being used?" — with charts over time.
Building a report
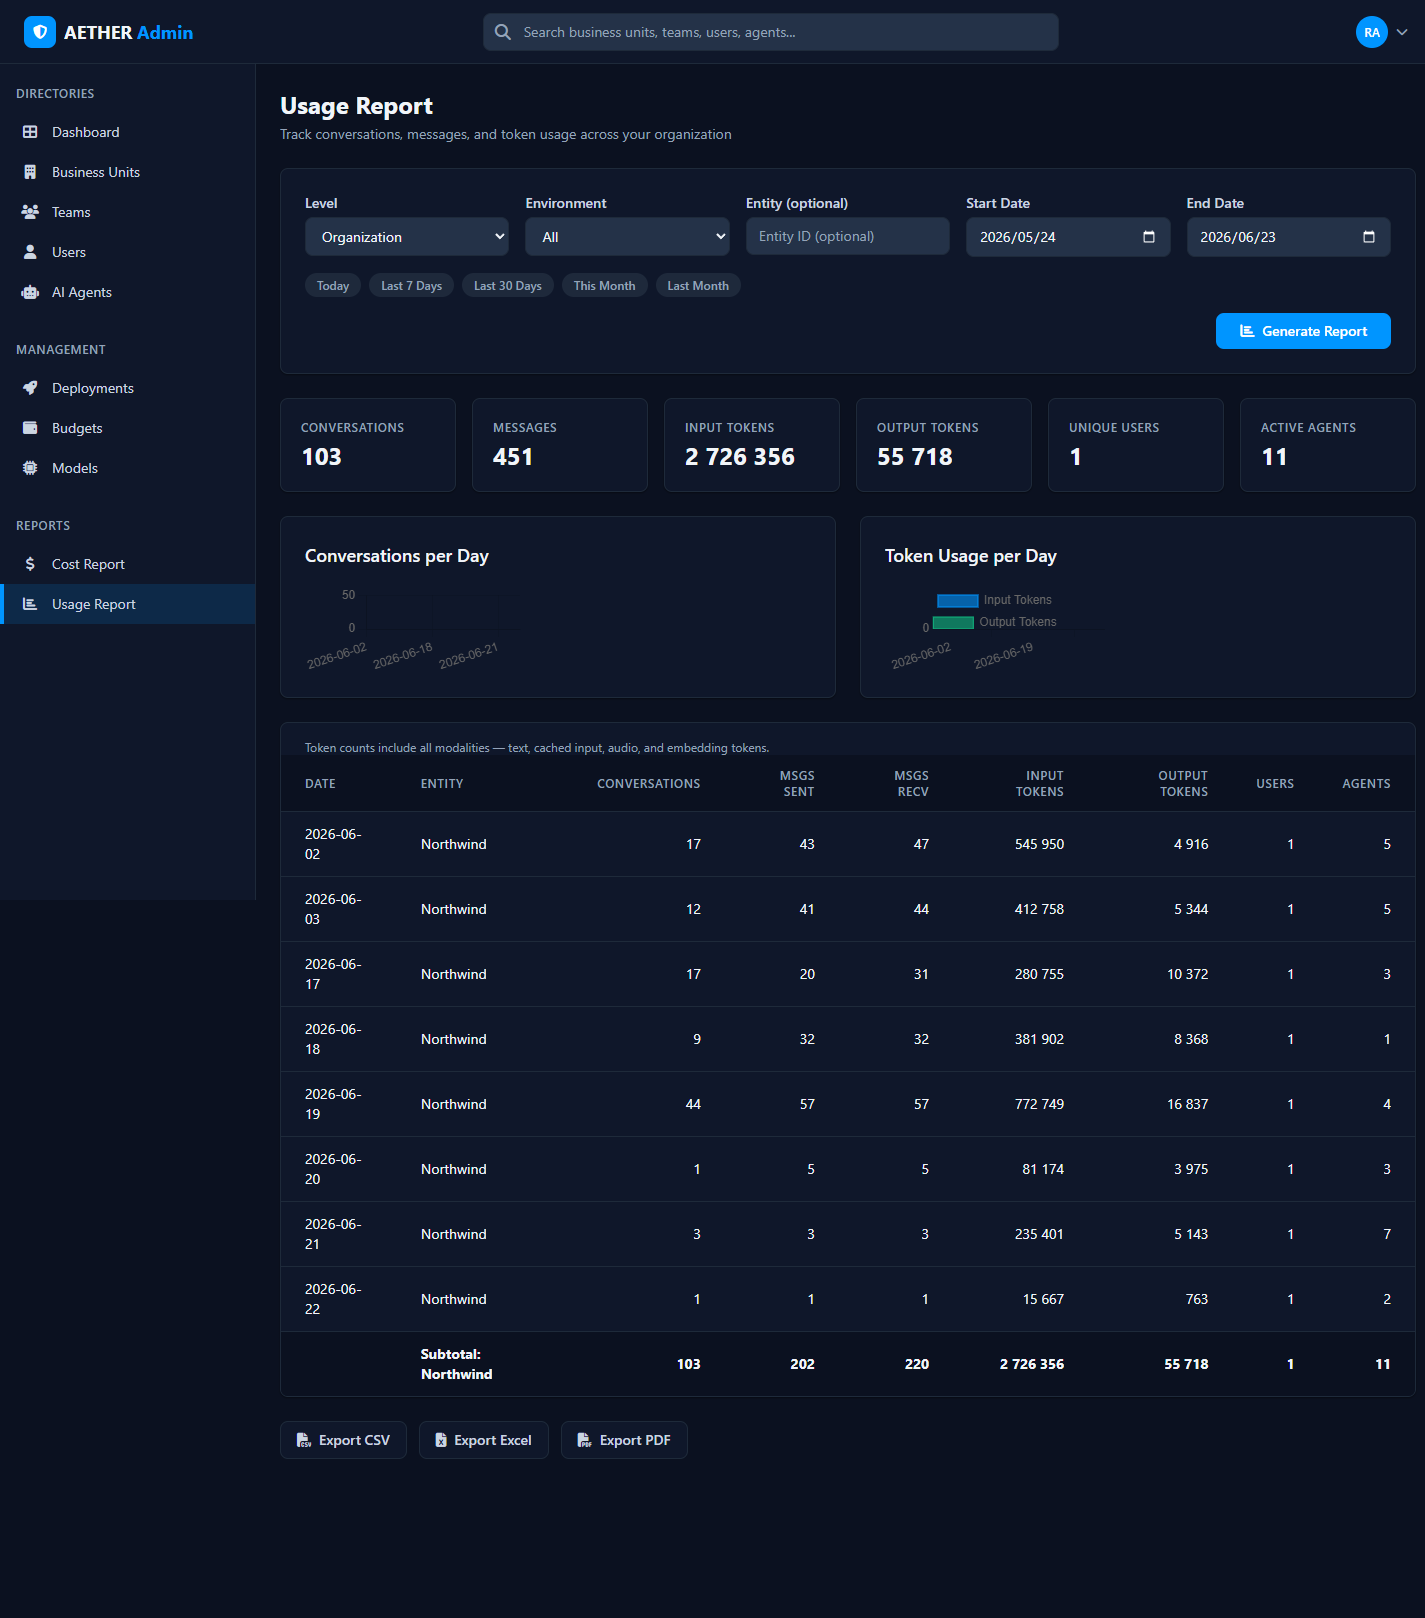
The filters mirror the Cost Report — Level, Environment, optional Entity, and a date range (with quick ranges) — then Generate Report.
What you get
- Summary cards — Conversations, Messages, Input Tokens, Output Tokens, Unique Users and Active Agents for the period.
- Conversations per Day — a line chart of conversation volume over time.
- Token Usage per Day — a bar chart of input vs output tokens per day.
- Daily breakdown — per-day, per-entity rows: conversations, messages sent/received, input and output tokens, users and agents.
Token counts include all modalities — text, cached input, audio and embedding tokens.
Reading the trends
The time-series charts make spikes and adoption obvious — a launch day, a busy period, or an agent that suddenly takes off. Pair the volume here with the spend in the Cost Report to spot anything that's growing faster than expected.
Tip: A rising output-token trend with flat conversations usually means responses are getting longer — a good prompt-tuning target.
Next steps
- Cost Report — the spend view of the same activity.
- Budgets — cap usage where it matters.