

Cost Report
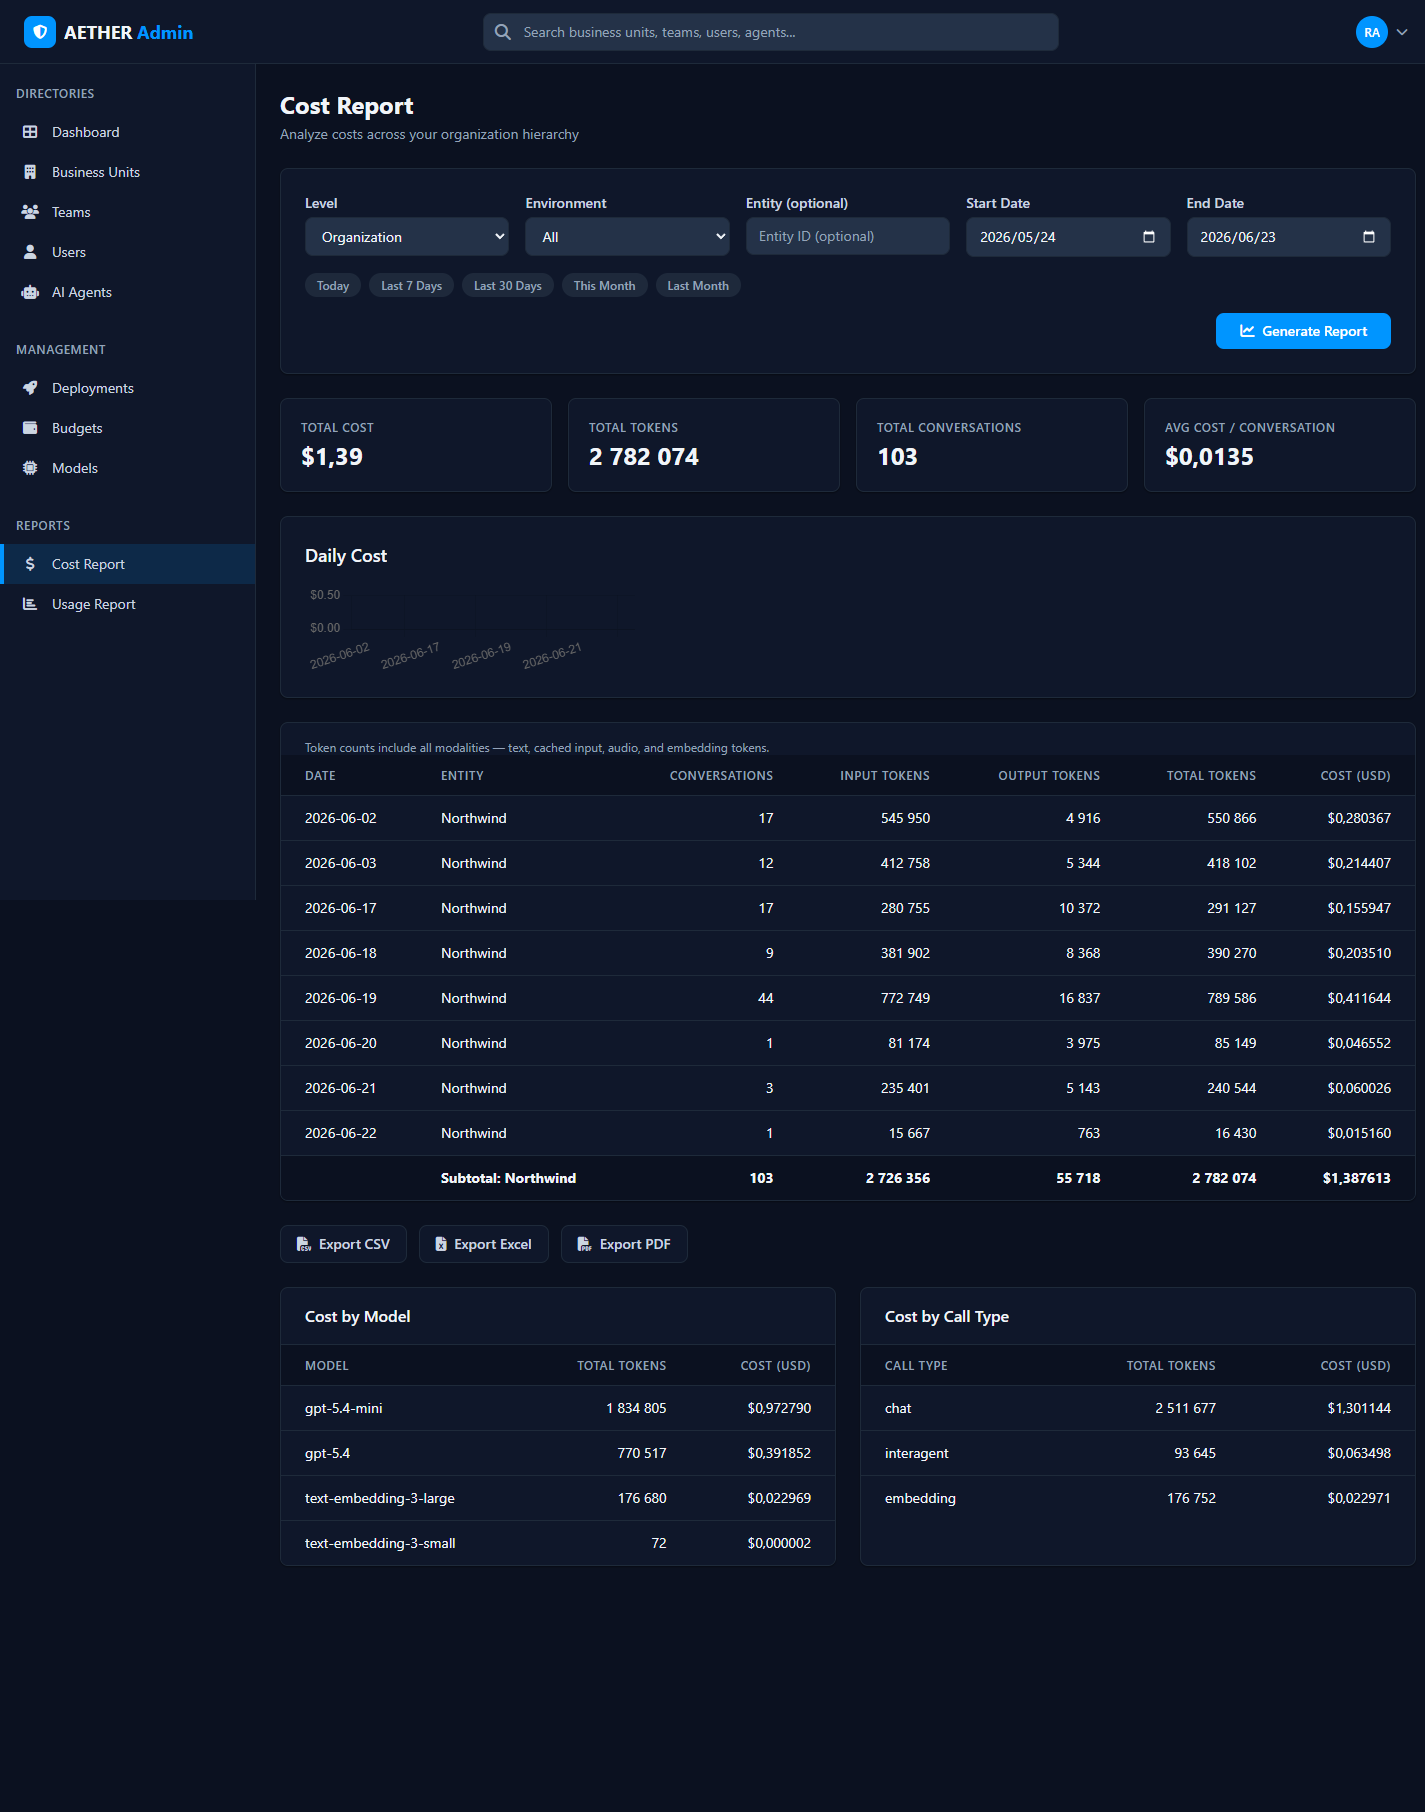
The Cost Report analyses spend across your organisation hierarchy. Choose a scope and date range, generate the report, and drill into where the money goes — then export it.
Building a report
Set the filters, then Generate Report:
- Level — Organization, Business Unit, Team, User or Agent.
- Environment — All, Development, QA or Release.
- Entity (optional) — narrow to a specific entity.
- Start / End date — or use a quick range (Today, Last 7 Days, Last 30 Days, This Month, Last Month).
What you get
- Summary cards — Total Cost, Total Tokens, Total Conversations, and Average Cost per Conversation.
- Daily breakdown — per-day rows with conversations, input/output tokens, total tokens and cost.
- Cost by Model — spend split across the models in use, showing the raw provider cost, the marked-up cost billed to the organisation, and the margin between them.
- Cost by Call Type —
chat,interagent(multi-agent) andembedding(RAG).
Token counts include all modalities — text, cached input, audio and embedding tokens.
Exporting
Export the report as CSV, Excel or PDF for finance, chargeback or record-keeping.
Tip: Use Cost by Call Type to understand why you're spending — a high
embeddingshare points at heavy ingestion; a highinteragentshare points at multi-agent collaboration.
Next steps
- Usage Report — the volume-focused companion view.
- Budgets — turn these insights into spend limits.